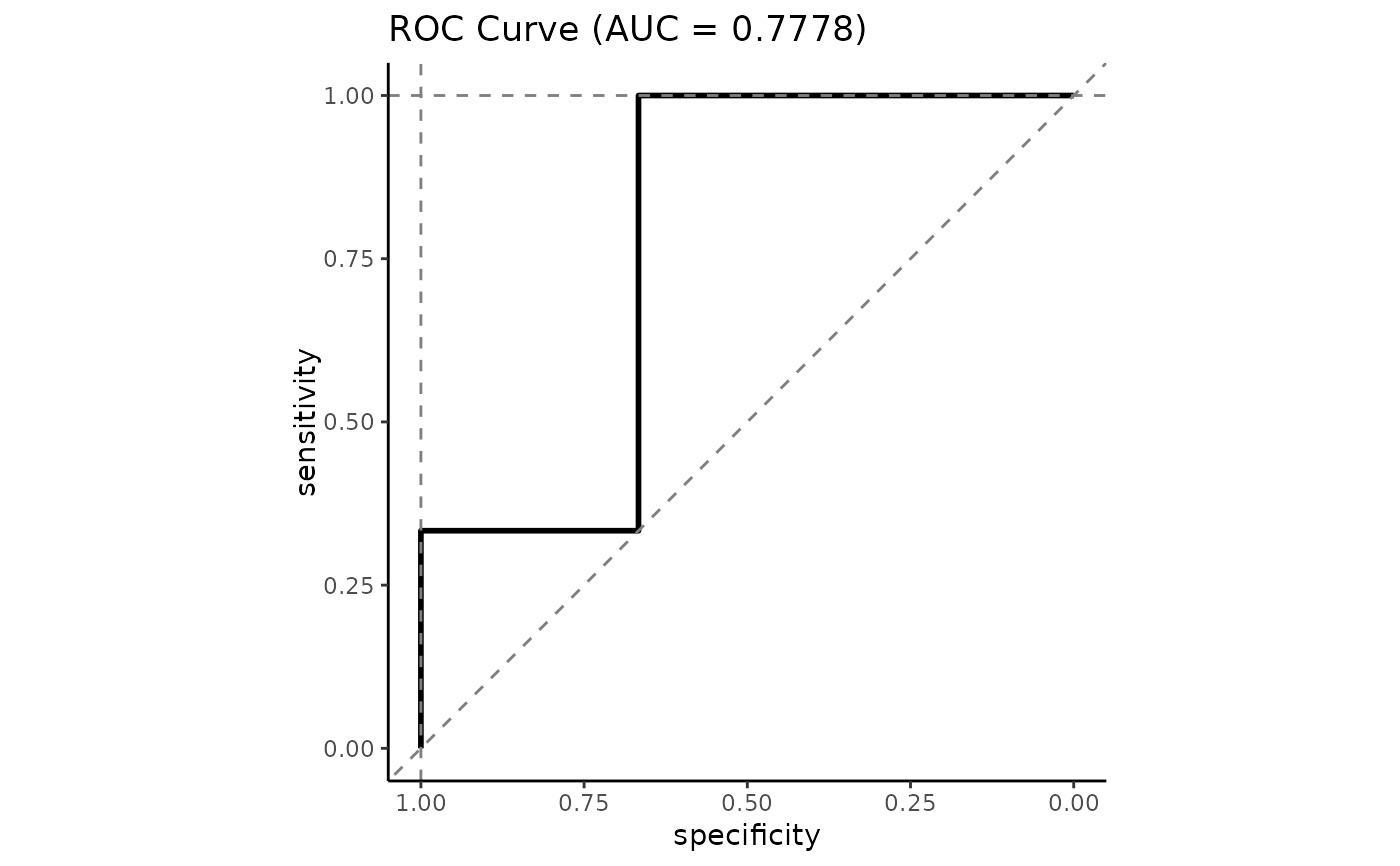
Compute ROC and AUC from target and prediction matrix and plot ROC. Target/prediction matrix should
have one column if output of layer with sigmoid activation and two columns for softmax activation.
Usage
plot_roc(y_true, y_conf, path_roc_plot = NULL, return_plot = TRUE)
Arguments
- y_true
Matrix of true labels.
- y_conf
Matrix of predictions.
- path_roc_plot
Where to store ROC plot.
- return_plot
Whether to return plot.
Value
A ggplot of ROC curve.
Examples
y_true <- matrix(c(1, 0, 0, 0, 1, 1), ncol = 1)
y_conf <- matrix(runif(n = nrow(y_true)), ncol = 1)
p <- plot_roc(y_true, y_conf, return_plot = TRUE)
#> You may need to call library(ggplot2) if you want to add layers, etc.
#> Loading required namespace: ggplot2
p
